 |
| Overclocking Results: |
|
|
Gigabyte's
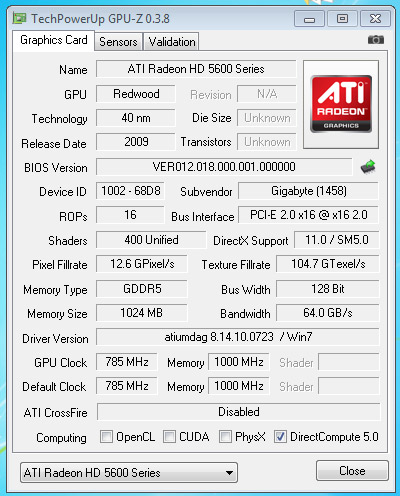
GV-R567OC-1GI videocard ships with its ATI Radeon HD 5670 GPU pre-overclocked by
a small 10MHz, up from 775MHz to 785MHz. The 1024MB of onboard GDDR5 memory runs
at 1000MHz.
As always, PCSTATS overclocked the videocard through ATI's Catalyst Control Center using ATI Overdrive. The fan was set to run at 100% from the start and PCSTATS started
with the GPU first, pausing to test the results with a quick 3D benchmark before
continuing. We take note of any stability problems or artifacts, then list the
maximum stable and artifact-free overclocked speed the videocard achieves.
We'll be
using ASUS' P5E3 Premium Intel X48 motherboard for these
overclocking tests, along with a nice set of Patriot DDR3-1866 low latency memory modules.
Given the ease in which most value-oriented ATI Radeon
videocards overclock, we cut to the chase and pushed the memory and GPU clock
speeds up as far as they could go. The Radeon HD 5670 handled 850MHz GPU /
1050MHz memory as if it was nothing, 3DMark06 passed without any artifacts or
instability. While it doesn't make for a very exciting overclocking section,
it's nice to know that economical videocards can easily be overclocked for an
additional edge... no matter how small.

Prelude to Benchmarks
The details of how the Gigabyte GV-R567OC-1GI videocard
was configured for benchmarking; the specific hardware, software drivers,
operating system and benchmark versions are indicated below. All benchmarks for
the videocard were run in Windows 7 Ultimate, the reference video cards were
tested in both Windows XP and Vista for the DX10 benchmarks.
PCSTATS is in the process of making the transition to a
Windows 7 and Intel CPU test platform, so keep this in mind as you scan the
benchmark results. In the second column are the general specs this videocard is
compared against.
 |
| PCSTATS Test System Configurations |
|
|
Benchmark results are organized by GPU manufacturer
first (AMD/ATI or nVidia), then by GPU generation, and then by GPU class (high
end, mainstream, value). This approach provides a clearer view of how
performance can differ from generation to generation, and class to previous
generation. The product being tested is marked with the red colour bar.
