CrystalDiskMark
3.0.1 Benchmark CrystalDiskMark
3.0.1 Benchmark |
Source:AS SSD |
|
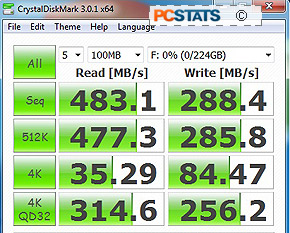
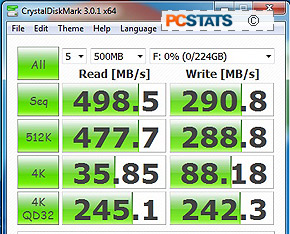
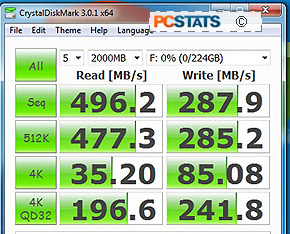
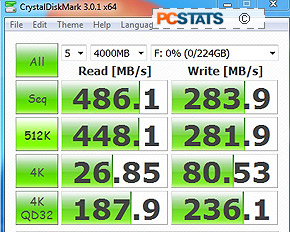
CrystalDiskMark is a drive benchmark tool which conducts a
series of Sequential, 512K and 4K read and write tests.
|
100MB
test
|
500MB
test
|
|
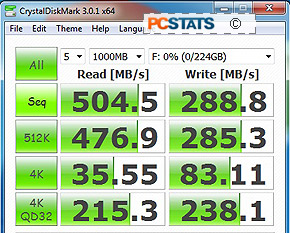
1000MB
test
|
2000MB
test
|
|
4000MB
test
|
|
CrystalDiskMark - SanDisk Extreme 240GB
SSD |
|
100MB Test |
500MB
Test |
1,000MB Test |
2,000MB Test |
4,000MB
Test |
|
Read |
Write |
Read |
Write |
Read |
Write |
Read |
Write |
Read |
Write |
| Sequential (MB/s) : |
483.1 |
288.4 |
498.5 |
290.8 |
504.5 |
288.8 |
496.2 |
287.9 |
486.1 |
283.9 |
| 512K (MB/s) : |
477.3 |
285.8 |
477.7 |
288.8 |
476.9 |
285.3 |
477.3 |
285.2 |
448.1 |
281.9 |
| 4K (MB/s) : |
35.29 |
84.47 |
35.85 |
88.18 |
35.55 |
83.11 |
35.2 |
85.08 |
26.85 |
80.53 |
| 4K QD32 (MB/s) : |
314.6 |
256.2 |
245.1 |
242.3 |
215.3 |
238.1 |
196.6 |
241.8 |
187.9 |
236.1 | |
The SanDisk Extreme 240GB SSD scores 483MB/s
in the 100MB Sequential Read test and 288MB/s in the Write test of
CrystalDiskMark. Peak results for this SSD are a Read score of 504MB/s and a Write score of 290MB/s in the 1000MB
test.
Next up, AS SSD
results...
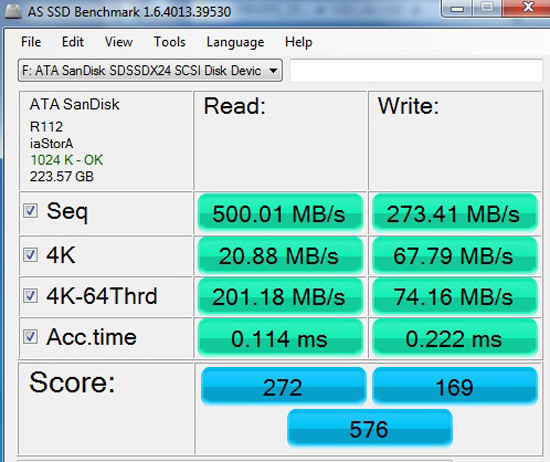
| AS SSD 1.6 Benchmark
|
Source:AS SSD |
|
The AS
SSD benchmark determines the performance of Solid State Drives (SSD). AS SSD benchmark is made specifically
to test SSD performance. It is a synthetic benchmark that gauges bandwidth and
latency speeds for solid state disks. Higher bandwidth (MB/s) is better, lower
latencies (ms) are better.