WinBench 99 is a
subsystem-level benchmark that measures the performance of a PC's graphics,
disk, and video subsystems in a Windows environment. WinBench 99's tests can run
on Windows 95, Windows 98, Windows NT, Windows 2000, and Windows Me
systems.
| WinBench 99 v1.2 Benchmark Results |
|
|
Epox 8K3A+ |
Score |
Ranking |
| 1. |
Business Disk - 133/333 MHz |
10000 |

|
| 1a. |
Business Disk - 180/360 MHz |
9800 |
|
|
|
|
|
| 2. |
High-End Disk - 133/333 MHz |
31200 |
|
| 2a. |
High-End Disk - 180/360 MHz |
29700 |
|
|
|
|
|
| 3. |
Business Graphics - 133/333
MHz |
950 |
 |
| 3a. |
Business Graphics - 180/360 MHz
|
1034 |
|
|
|
|
|
| 4. |
High-End Graphics - 133/333
MHz |
1630 |
|
| 4a. |
High-End Graphics - 180/360 MHz
|
1760 |
|
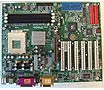
The Epox
does very well in Winbench 99 scores very high in the disk benchmarks as well as
the graphics.