 |
| Overclocking Results: |
|
|
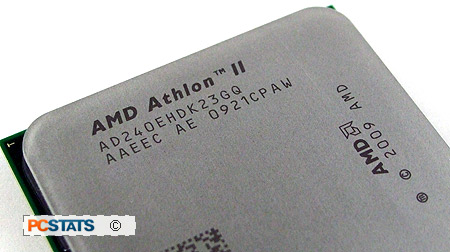
AMD's 2.8GHz dual-core 45nm Athlon II X2 240e energy
efficient processor is based on the 'Regor' architecture, and we're expecting
its peak overclocking to be in the same ballpark as the AMD Athlon II X2 250 processor (which went from 3.0GHz up to
3.75GHz on air cooling).
First thing's first. In order not to hold the processor
back the Corsair DDR3-1066 CM3X2G1600C9DHX memory was set to run in DDR3-800 MHz
mode. The CPU clock multiplier was kept at its default of 14x and from there the
bus speed on the Gigabyte GA-MA790FXT
motherboard was increased from 200MHz on up.
 Overclocking in 15 MHz
increments, the Athlon II X2 240e CPU was rapidly overclocked from 200MHz to
215MHz... 230... 240... 250 and then 260MHz. Unfortunately the chip wasn't able
to maintain this speed and crashed moments after POST. The bus speed had to be
reduced to 250MHz before the processor would play nice, so in the end AMD's
Athlon II X2 240e processor overclocked from 2.8GHz to a decent 3.5GHz on standard air cooling.
PCSTATS got a similar 700MHz overclock from the Athlon
II X2 250 processor, but it's a little disappointing that the Athlon II X2 240e
fell short of 3.7GHz.
Of course, we should also point out that this 45W
processor really is not intended for overclocking in the first place. Doing so
defeats the purpose of buying an energy efficient processor, doesn't it?
Prelude to
Benchmarks
For this review PCSTATS is running the benchmark suite
in both Microsoft Windows Vista and Microsoft Windows 7 operating systems.
Hopefully this will help you make an informed decision in the coming months as
Windows 7 adoption firms up. For the most part, benchmark results are not
significantly different between the two operating systems, although certain
tests do see advantages under Win 7.
Over the following page we'll be running
AMD's 2.8GHz Athlon II X2 240e processor though PCSTATS standard set of gaming,
productivity, and multi-threaded processor benchmarks. There are a wide variety
of gaming and synthetic benchmarks here to illustrate what kind of performance
boost users can expect from the latest dual-core socket AM3 AMD processor.
Please take a moment to look over PCSTATS test system configurations before
moving on to the individual benchmark results on the next several pages.
 |
| PCSTATS Test System Configurations |
|
test system |
reference system #1 |
reference system #2 |
reference system #3 |
| processor: |
amd Phenom II X4 965 Black Edition
AMD Phenom II X4 955 Black
Edition
AMD Phenom II X3 720 Black
Edition
AMD Phenom II X2 550 Black
Edition
AMD Athlon II X4 620
AMD Athlon
II X3 435
AMD Athlon II X2 250
AMD Athlon II
X2 240e |
Intel Core i5 750 |
Intel Core i7 920 |
Intel Core 2 Duo E8500
Intel Core 2 Duo E8400 |
| CPU
Process Technology: |
45nm |
45nm |
45nm |
45nm |
| Socket: |
Socket AM3 |
Socket
LGA1156 |
Socket
LGA1366 |
Socket
LGA775 |
| Clock
Speed: |
17x 200MHz = 3.4 GHz (965 BE)
16x 200MHz = 3.2 GHz(955 BE)
14 x 200 MHz = 2.8 GHz (720 BE)
15.5x 200MHz = 3.1 GHz (550BE)
13x 200MHz = 2.6 GHz (AIIX4 620)
14.5x 200MHz = 2.9 GHz (AIIX3 435)
15x 200MHz = 3.0 GHz (AIIX2 250)
14x 200 MHz = 2.8
GHz (AIIX2 240e)
|
20x 133MHz =
2.66 GHz |
20 x 133 MHz =
2.67 GHz |
9.5 x 333 MHz =
3.16GHz (E8500)
9 x 333 MHz = 3.0 GHz< BR
> (E8500) |
| Motherboard: |
Gigabyte GA-MA790FXT-UD5P (AMD
790FX) |
Gigabyte
GA-P55-UD6 (Intel P55)
|
MSI X58 Platinum
(X58 Express) |
MSI X48
Platinum (X48 Express) |
| Videocard: |
ASUS ENGTS250 DK
(Geforce GTS250) |
ASUS ENGTS250 DK
(Geforce GTS250) |
ASUS ENGTS250 DK
(Geforce GTS 250) |
MSI NX8800GTS-T2D320E
(Geforce 8800GTS) |
| Memory: |
2x2GB Corsair XMS3-1600C9 DDR3
2x1GB Patriot PDC32G1600LLK DDR3 |
2x2GB Corsair XMS3-1600C8
DDR3 |
3x2GB Corsair TR3X6G1600C8D
DDR3 |
2x1GB Patriot PDC32G1600LLK DDR3 |
| Hard
Drive: |
74GB Western Digital Raptor WD740 |
| Optical Drive: |
ASUS BC-1205PT-BD |
| Power
Supply: |
PC Power & Cooling TurboCool 750W |
| Heatsink: |
Athlon64 K8 Reference Heatsink |
Intel Reference
1156 Heatsink |
Intel Reference
1366 Heatsink |
Intel Reference 775 Heatsink |
| Software Setup: |
Microsoft
Windows Vista Ultimate
Microsoft Windows 7
Ultimate
AMD Catalyst 9.8
nVIDIA Forceware 190.62 |
Microsoft
Windows Vista Ultimate
Microsoft Windows 7
Ultimate
Intel 9.1.1.1019
nVIDIA Forceware 190.62 |
Microsoft
Windows Vista Ultimate
Intel INF
9.1.0.1012
nVIDIA Forceware
182.08 |
Microsoft
Windows Vista Ultimate
Intel INF
9.0.0.1008
nVIDIA Forceware
169.25 |
| Benchmarks: |
System Benchmarks:
SYSmark 2007
PCMark Vantage
SiSoft Sandra 2009 |
Calculation B/M:
Super Pi 1.5
wPrime 2.0
ScienceMark 2.3
WinRAR 3.8
Bibble
5 |
Rendering
B/M:
Cinebench R10
POV-Ray 3.7
SPECviewPerf 10 |
Gaming
B/M:
3DMark06
3DMark Vantage
Cyrsis
FEAR
| | |
