 SiSoft Sandra 2008
 |
Source: Sandra |
Sandra is designed to
test the theoretical power of a complete system as well as the individual
components. The results are also purely theoretical and may not represent real
world performance.
|
Sisoft Sandra 2005 Benchmark
Results |
|
Optical Drive |
LG GSA-H62N |
Lite-On iHAS424 |
AOpen DSW1812P |
Samsung WriteMaster SE-W164 |
Gigabyte GO-W1616A |
MSI DR16-B |
AOpen DRW8800 |
AOpen 5232 Combo |
LG GSA-4082B |
| Disc Type |
Data |
Data |
Data |
Data |
Data |
Data |
Data |
Data |
Data |
| Drive Index |
3785 kb/s |
3622 kb/s |
3495 kb/s |
3005 kb/s |
3041 kb/s |
2912 kb/s |
3056 kb/s |
2574 |
1627 |
| Buffered Read: |
3414 kb/s |
3123 kb/s |
3040 kb/s |
2564 kb/s |
2345 kb/s |
2480 kb/s |
2567 kb/s |
6000 kb/s |
779 kb/s |
| Sequential Read: |
3983 kb/s |
3822 kb/s |
3710 kb/s |
3140 kb/s |
3347 kb/s |
3135 kb/s |
3258 kb/s |
2712 kb/s |
2362 kb/s |
| Random Read: |
3357 kb/s |
3417 kb/s |
3187 kb/s |
2802 kb/s |
2641 kb/s |
2577 kb/s |
2752 kb/s |
2336 kb/s |
524 kb/s |
| Access Time: |
243ms |
200ms |
179ms |
157ms |
213ms |
283ms |
231ms |
220 ms |
761ms |
Lite-on's iHAS424 does quite well in SiSoft
Sandra's drive index tests, second only to LG's GSA-H62N.
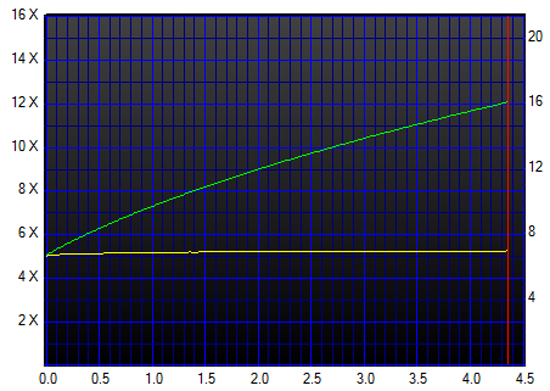
CD Speed is a
CD/DVD-ROM benchmark which can test the most important features of an optical
drive. In this particular benchmark, we use a pressed CD-ROM with about 640MB of
data as the test disk. Using a CDR or CDRW as the test disk may impact the
results slightly, so a pressed disk is the standard testing tool.
| Nero CD Speed: Data |
 |
|
|
|
|
Nero CD Speed: Data
Benchmark Results |
| Optical Drive |
ASUS BC-1205PT |
LG GSA-H62N |
Lite-On
iHAS424 |
AOpen DSW1812P |
Samsung WriteMaster SE-W164 |
Gigabyte GO-W1616A |
MSI DR16-B |
AOpen DRW8800 |
AOpen 5232 Combo |
LG GSA-4082B |
| Disc Type |
Data |
Data |
Data |
Data |
Data |
Data |
Data |
Data |
Data |
Data |
| Avg Speed |
23.17x |
33.4x |
36.77 |
34.11x |
28.94x |
34.47x |
28.93x |
30.05x |
36.07x |
23.08x |
| Random Seek Time |
138ms |
122ms |
100ms |
88ms |
85ms |
124ms |
100ms |
113ms |
87ms |
108ms |
| 1/3 Seek Time |
149ms |
118ms |
115ms |
99ms |
84ms |
126ms |
109ms |
111ms |
88ms |
142ms |
| Full Seek Time |
267ms |
115ms |
122ms |
140ms |
142ms |
209ms |
155ms |
154ms |
132ms |
195ms |
| CPU Use: 1x |
0% |
1% |
1% |
2% |
3% |
1% |
1% |
0% |
4% |
1% |
| CPU Use: 2x |
1% |
2% |
2% |
4% |
6% |
6% |
2% |
1% |
2% |
2% |
| CPU Use: 4x |
2% |
3% |
4% |
7% |
3% |
8% |
4% |
2% |
3% |
4% |
| CPU Use: 8x |
4% |
27% |
4% |
12% |
7% |
11% |
7% |
5% |
7% |
3% |
| Disc recognition Time |
0.05s |
10.68s |
4.8s |
8.34s |
10.64s |
12.4s |
6.04s |
8.73s |
8.17s |
7.68s |
| Disc Eject Time |
1.22s |
2.82s |
2.21s |
1.3s |
1.92s |
1.23s |
1.85s |
1.71s |
1.4s |
4.61s |
| Disc Load Time |
16.54s |
1.49s |
1.1s |
1.27s |
1.18s |
1.18s |
1.32s |
0s |
1.03s |
0.98s |
The Lite-On
iHAS424 does a good job in this test as well, with the highest average speed of
any optical drives PCSTATS has tested so far.
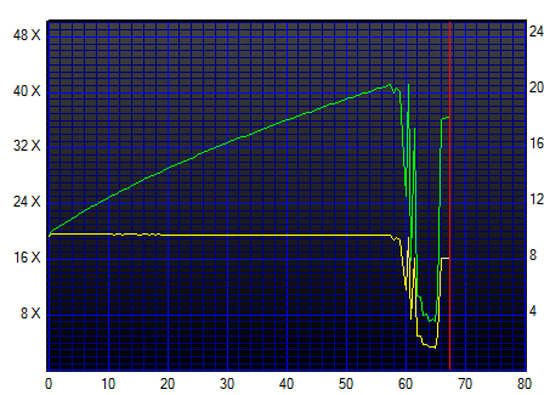
CD Speed is a
CD-ROM benchmark which can test the most important features of a CD-ROM drive.
In this particular benchmark we use a pressed Audio CD with about 65 minutes of
audio on it as the test disk. CDROMs in general have a harder time processing
audio data, and hence the results can be drastically slower than equivalent
'pure' data tests.
| Nero CD Speed: Audio |

|
|
|
|
|
Nero CD Speed: Audio
Benchmark Results |
| Optical Drive |
ASUS BC-1205PT |
LG GSA-H62N |
Lite-On
iHAS424 |
AOpen DSW1812P |
Samsung WriteMaster SE-W164 |
Gigabyte GO-W1616A |
MSI DR16-B |
AOpen DRW8800 |
AOpen 5232 Combo |
LG GSA-4082B |
| Disc Type |
Audio |
Audio |
Audio |
Audio |
Audio |
Audio |
Audio |
Audio |
Audio |
Audio |
| Avg Speed |
24.65x |
30.35x |
30.44 |
33.19x |
28.34x |
30.04x |
8.21x |
24.02x |
32.74x |
18.46x |
| Random Seek Time |
178ms |
109ms |
103ms |
99ms |
95ms |
141ms |
140ms |
114ms |
95ms |
114ms |
| 1/3 Seek Time |
193ms |
119ms |
124ms |
106ms |
103ms |
146ms |
240ms |
121ms |
105ms |
137ms |
| Full Seek Time |
332ms |
140ms |
168m,s |
159ms |
175ms |
276mx |
272ms |
171ms |
186ms |
204ms |
| DAE Quality |
10 |
10 |
10 |
10 |
10 |
10 |
10 |
10 |
10 |
10 |
| CPU Use: 1x |
1% |
1% |
5% |
1% |
19% |
12% |
1% |
1% |
1% |
1% |
| CPU Use: 2x |
2% |
2% |
1% |
1% |
2% |
3% |
3% |
1% |
2% |
2% |
| CPU Use: 4x |
5% |
3% |
2% |
3% |
4% |
10% |
6% |
3% |
4% |
5% |
| CPU Use: 8x |
11% |
5% |
3% |
6% |
7% |
15% |
10% |
7% |
8% |
9% |
| Disc recognition Time |
0.03s |
12.44 |
0.02 |
9.99s |
8.46s |
9.9s |
6.17s |
8.23s |
6.59s |
7.79s |
| Disc Eject Time |
1.23 |
2.83 |
1.71 |
1.29s |
1.92s |
1.22s |
1.79s |
1.71s |
1.04s |
2.01s |
| Disc Load Time |
15.38s |
1.49 |
11.50 |
1.26s |
1.26s |
1.18s |
1.32s |
0.13s |
1.41s |
1.33 |
Here we go from stellar results to just
about average, with an average read speed of about 30x.
