Here's how the ASUS ENGTX260 MT/HTDI/896MD3-A
videocard stacks up in real life against a couple different cards. PCSTATS
measures total system power draw and compares that in 3D loaded (max value
recorded in 3DMark06) and idle states (at Windows desktop). The power supply
used in each test is an A-PFC compliant PC Power and
Cooling 750W model.
 Videocard Power Consumption (Total System Power
Draw) Videocard Power Consumption (Total System Power
Draw) |
| Idle at Desktop |
Watts |
Ranking |
| Palit HD4870 X2 2GB |
177 |
   |
| ASUS EAH3870 X2 1GB TOP/G/3DHTI/1G/A |
153 |
   |
| ASUS EAH3870 X2 1GB TOP/G/3DHTI/1G/A (Crossfire) |
222 |
   |
| MSI R3870X2-T2D1G-OC |
165 |
   |
| ASUS EAH4890 HTDI/1GD5/A |
137 |
   |
| ASUS EAH4850 HTDI/512M |
120 |
   |
| MSI R4830 T2D512-OC (Radeon 4830) |
108 |
   |
| Gigabyte GV-R477D5-512HB |
135 |
   |
| Gigabyte GV-R477D5-512HB Crossfire |
180 |
   |
| ASUS EAH4770 HTDI/512MD5/A |
101 |
   |
| Diamond Viper Radeon HD 2900XT CrossFire |
195 |
   |
| ASUS EAX1900XTX 2DHTV/512M/A |
160 |
   |
| ASUS EAX1950PRO/HTDP/256M/A |
150 |
   |
 ASUS ENGTX260 MT/HTDI/896MD3-A ASUS ENGTX260 MT/HTDI/896MD3-A |
135 |
   |
| Gigabyte GV-N26OC896H-GA |
112 |
   |
| Sparkle GTX260 Core 216 |
140 |
   |
| ASUS ENGTS250 DK |
120 |
   |
| ASUS ENGTS250 DK in SLI |
170 |
   |
| Gigabyte GV-N96TSL-1GI |
96 |
   |
| nVidia Geforce 9600GTs in SLI |
166 |
   |
| ASUS EN9600GT Top/HTDI/512M |
152 |
   |
| Palit Geforce 9600GT 512 |
151 |
   |
| MSI NX8800GTX-T2D768E |
196 |
   |
| MSI NX7950GX2-T2D1GE |
183 |
   |
| MSI NX7900GTX-T2D512E |
165 |
   |
| Gigabyte GV-NX76T256D-RH |
140 |
   |
| 3D Loaded: |
Watts |
Ranking |
| Palit HD4870 X2 2GB |
421 |
   |
| ASUS EAH3870 X2 1GB TOP/G/3DHTI/1G/A |
390 |
   |
| ASUS EAH3870 X2 1GB TOP/G/3DHTI/1G/A (Crossfire) |
610 |
   |
| MSI R3870X2-T2D1G-OC |
330 |
   |
| ASUS EAH4890 HTDI/1GD5/A |
225 |
   |
| ASUS EAH4850 HTDI/512M |
202 |
   |
| MSI R4830 T2D512-OC (Radeon 4830) |
177 |
   |
| Gigabyte GV-R477D5-512HB |
186 |
   |
| Gigabyte GV-R477D5-512HB Crossfire |
279 |
   |
| ASUS EAH4770 HTDI/512MD5/A |
153.3 |
   |
| Diamond Viper Radeon HD 2900XT CrossFire |
549 |
   |
| ASUS EAX1900XTX 2DHTV/512M/A |
333 |
   |
| ASUS EAX1950PRO/HTDP/256M/A |
252 |
   |
 ASUS ENGTX260 MT/HTDI/896MD3-A ASUS ENGTX260 MT/HTDI/896MD3-A |
277 |
   |
| Gigabyte GV-N26OC896H-GA |
215 |
   |
| Sparkle GTX260 Core 216 |
262 |
   |
| ASUS ENGTS250 DK |
214 |
   |
| ASUS ENGTS250 DK in SLI |
316 |
   |
| Gigabyte GV-N96TSL-1GI |
160 |
   |
| nVidia Geforce 9600GTs in SLI |
313 |
   |
| ASUS EN9600GT Top/HTDI/512M |
220 |
   |
| Palit Geforce 9600GT 512 |
221 |
   |
| MSI NX8800GTX-T2D768E |
345 |
   |
| MSI NX7950GX2-T2D1GE |
315 |
   |
| MSI NX7900GTX-T2D512E |
277 |
   |
| Gigabyte GV-NX76T256D-RH |
213 |
   | |
At idle,
the ASUS ENGTX260 MT/HTDI/896MD3-A videocard draws about as much
power as the Radeon HD 4890. Being able to idle an entire system at 135W is a
pretty good result, although the Gigabyte Geforce 260 manages to squeak past at
a mere 112W.
Under load the ASUS ENGTX260 isn't quite as elegant, drawing significantly
more power than all of the AMD R700-based GPUs, as well as sucking up more
wattage than both Gigabyte and Sparkle's Geforce GTX 260 graphics cards.

The
majority of spikes in the above power draw chart
indicate dual videocard SLI or Crossfire test situations, modern videocards
have become a lot more power efficient thanks largely to die shrinks and
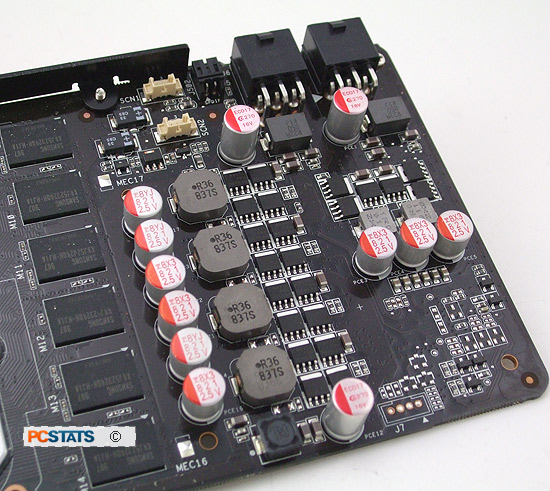
optimization. ASUS' ENGTX260 MT/HTDI/896MD3-A videocard itself will require two 6-pin auxiliary
SLI power connectors, but when stressed the total power draw doesn't break
300 Watts.
Prelude to
Benchmarks:
The details of how the ASUS ENGTX260
MT/HTDI/896MD3-A videocard test system was configured for benchmarking; the specific hardware,
software drivers, operating system and benchmark versions are indicated below.
In the second column are the general specs for the reference platforms this
nVidia GeForce GTX260 (core 216) 896MB based videocard is to be compared
against. Please take a moment to look over PCSTATS test system configurations
before moving on to the individual benchmark results on the next page.
 |
| PCSTATS Test System Configurations |
|
|
Benchmark results are organized by GPU manufacturer first
(AMD/ATI or nVidia), then by GPU generation, and then by GPU class (high end,
mainstream, value). This approach provides a clearer view of how performance can
differ from generation to generation, and class to previous generation. The
product being tested is marked with the red colour bar.
