AMD talked a bit about benefits for 'Bulldozer'
when paired with Microsoft's upcoming Windows 8 operating system. At the moment
there is a Windows 8 Developer Preview available
from Microsoft Dev Center.
In this short article PCSTATS will test this claim by comparing identical computer systems
running an AMD FX-8150 'Bulldozer' processor, under both operating systems.
PCSTATS decided to compare the AMD FX-8150 processor against itself in
Windows 8 and Windows environments and see what kind of performance gains
AMD was talking about. Going into this test we (frankly) did not expect Windows
8 to come out ahead, mainly because of the sheer frustration of working in
Windows 8 Developer.... but on closer examination of the benchmark results the
AMD FX-8150 CPU does, on average, see a benefit from this upcoming OS.
It's exciting to test out a brand new processor in an unreleased operating
system such as Microsoft Windows 8 Developer, so before diving into 'Bulldozer's
architecture, fantastic overclockability or it's mixed bag of results compared
to competing CPUs, we wanted to jump ahead and post this quick
little Windows 8 vs. Windows 7 face off. See the
full AMD FX-8150 processor review for how this 3.6GHz 8-core processor
stacks up against competing Intel and AMD flagship chips.
|

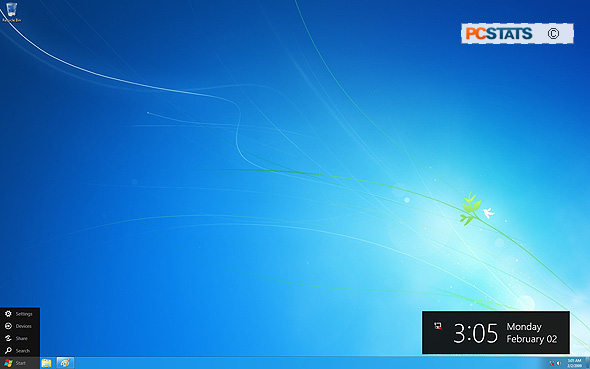
Windows 8 Developer desktop - looks like
Windows 7, runs a hair faster.
|
Since the hardware was identical between the two tests so we're not going to
bother with a boring test system spec chart. Explanations after the
benchmark chart.
 |
Windows 8
(Developer
Preview)
|
Windows 7
|
|
AMD FX-8150 |
AMD FX-8150 |
| -
SiSoft Sandra 2011 - Processor |
| Processor Arithmetic Dhrystone ALU: (GIPS)
|
87.64 |
88.16
|
| Processor Arithmetic Whetstone iSSE3:
(Gflops) |
62.82 |
62.87
|
| Processor Multi-Media Int x8 iSSE3:
(Mpixels/s) |
210.79 |
221.27 |
| Processor Multi-Media Float x4 iSSE2:
(Mpixels/s) |
136.66 |
100.37 |
| Processor Multi-Media Float x2 iSSE2:
(Mpixels/s) |
76.36
|
56.2 |
| -
SiSoft Sandra 2011 - Memory |
| Multicore Efficiency Bandwidth: (GB/s) |
10.45
|
9.35 |
| Multicore Efficiency Latency: (ns) |
173.6
|
206.7 |
| Memory Bandwidth Int iSSE2: (GB/s) |
16
|
15.56 |
| Memory Bandwidth Float iSSE2: (GB/s) |
16
|
15.56 |
| Memory Latency (Random): (ns) |
82.5 |
82.3
|
| Memory Latency (Linear): (ns) |
10.7 |
10.9
|
|
|
|
| - SYSMark 2007 Preview 1.06 |
| Overall: |
.... failed |
215
|
| E-Learning: |
.... failed |
169
|
| Videocreation: |
.... failed |
341
|
| Productivity: |
.... failed |
185
|
| 3D: |
.... failed |
202
|
|
|
|
| -
Futuremark PCMark Vantage 1.0.0.0 |
| Overall: |
.... failed |
13240 |
| Memory: |
9326
|
8917 |
| TV and Movies: |
.... failed |
6593 |
| Gaming: |
8640
|
8089 |
| Music: |
14273
|
13165 |
| Communications: |
.... failed |
13550 |
| Productivity: |
.... failed |
13344 |
| HDD: |
29476
|
28263 |
|
|
|
| -
Bibble 5.0 |
| Time to Complete 50 Photo's: (sec) |
9.39 |
9.36
|
| Batch RAW-to-JPEG Conversion: (sec/Image)
|
0.188 |
0.187
|
|
|
|
| -
ScienceMark 2.3 |
| Primordia: (sec) 2-core |
290.31845 |
292.3531 |
| Mol Dyn: (sec) 2-core |
74.86448 |
69.18975 |
|
|
|
| -
Cinebench R10 |
| 1 CPU (split between cores) |
2867 |
2895
|
| x CPU (full load all cores) |
14785
|
14431 |
|
|
|
| -
Super Pi Mod 1.5 XS |
| 1 Million Digits: (sec) |
22.164 |
21.981 |
| 16 Million Digits: (sec) |
566.776 |
576.374 |
|
|
|
| -
wPrime 2.0 |
| 32 Million Digits (1 thread): (sec) |
49.077 |
53.567 |
| 32 Million Digits (2 thread): (sec) |
24.897 |
26.987 |
| 32 Million Digits (3 thread): (sec) |
19.858 |
18.326 |
| 32 Million Digits (4 thread): (sec) |
14.726 |
15.538 |
| 32 Million Digits (5 thread): (sec) |
13.058 |
13.153 |
| 32 Million Digits (6 thread): (sec) |
10.951 |
11.979 |
| 32 Million Digits (7 thread): (sec) |
9.766
|
10.72 |
| 32 Million Digits (8 thread): (sec) |
8.876
|
9.895 |
|
|
|
| -
Pov-Ray 3.7 BETA 30 |
| Render Time (sec) |
64.27 |
63.77
|
| Render Average (Pixels Per Sec) |
4078.67 |
4110.64 |
|
|
|
| -
Futuremark 3DMark06 1.1.0 |
| Overall: |
15075 |
15326
|
| CPU: |
5401 |
5807
|
|
|
|
| -
Futuremark 3DMark08 Vantage 1.0.1 |
| Performance Overall: (P) |
7886 |
7900
|
| CPU Score: |
18936
|
18936
|
|
|
|
| -
Crysis v1.2.1 No AA |
| 800x600 LQ Physics Very High (FPS) |
would not run |
would not run |
| 1024x768 LQ Physics Very High (FPS) |
would not run |
would not run |
|
|
|
| -
Sierra FEAR 1.08 No AA |
| 800x600 LQ |
605
|
573 |
| 1024x768 LQ |
595
|
565 |
|
|
|
| Number of times out performed other OS: |
24 |
21 | |
For the most
part Windows 8 saw a 1%-5% improvement with the AMD FX-8150 processor, though
benchmarks like Sandra's multi-media float x4 test net a healthy 26% improvement
in Windows 8.
Unfortunately, Sysmark refused to run in Windows 8 and PCMark
Vantage gave up the ghost for half of its sub-tests. Where PCMark Vantage
did work correctly, the results saw an average 4% - 6% improvement in Windows 8 vs. Windows
7. Computational benchmarks
like Bibble 5.0, Sciencemark and SuperPi were too close to call.
WPrime shaved
a whole second off its score compared to the results achieved by the AMD FX-8150 in
Windows 7. Cinebench was inconclusive. With 'One CPU' core loaded the Windows 7/FX-8150
platform came out ahead. With 'All CPU Cores' loaded the Windows 8/FX-8150
saw a 2% lead. 3DMark 06 and 3DMark Vantage clearly favoured the
Windows 7 environment while FEAR benefited 5% from Windows 8. The Crysis
benchmark refused to een run on the FX-8150 chip, regardless of the
operating system.
|

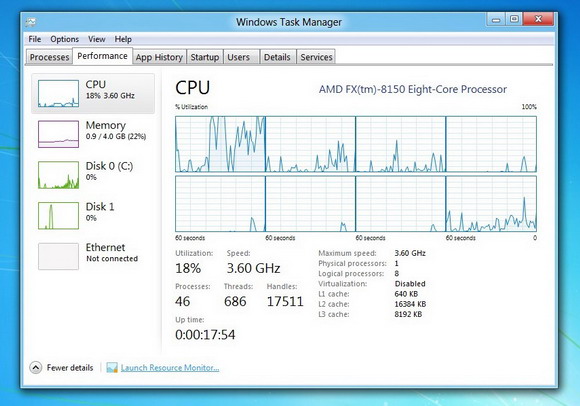
Windows 8 Developer
Task Manager - love it!
|

