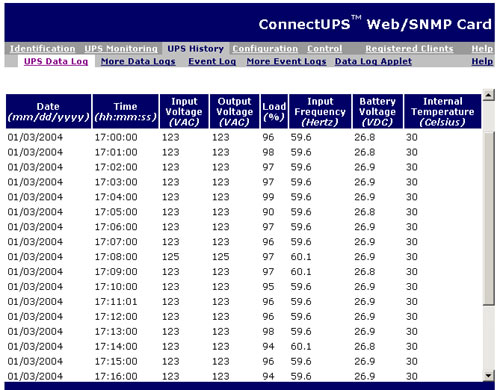
The system records
a concise set of stats on input/output voltage, % load, temperature, battery
charge, and date/time every minute the UPS is online.

This comes in handy if you are looking for problems with
anyone of the sets of recorded data - say for example a dip in utility
voltage at a specific time of day.

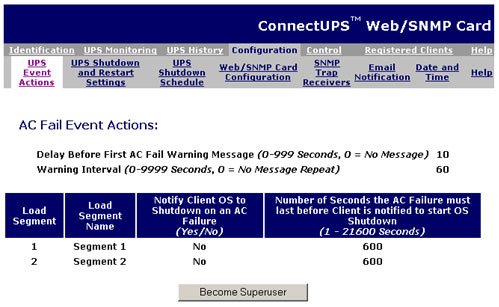
In the event of power failure, the Powerware 5125
can be set to take specific actions, such as shutting down a load segment,
computers loaded with the Netwatch Client software, or even pausing before doing
something.

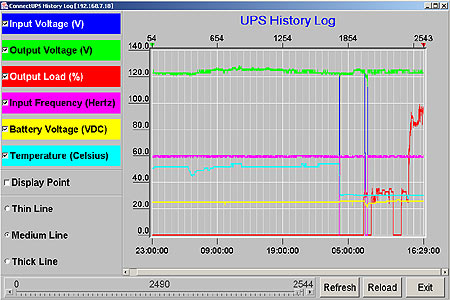
The feature we used most during testing was the
"Data Log Applet," which uses Javascript to display stats for a variety of power,
temperature, and time values in an easy to read chart. In the example here,
you can see the effects on the power supply from first running the UPS normally,
running the battery life tests (blue line), and then loading Powerware 5125 to
100% and over (red line).
